03 Best Fit Line
Which line is the best?
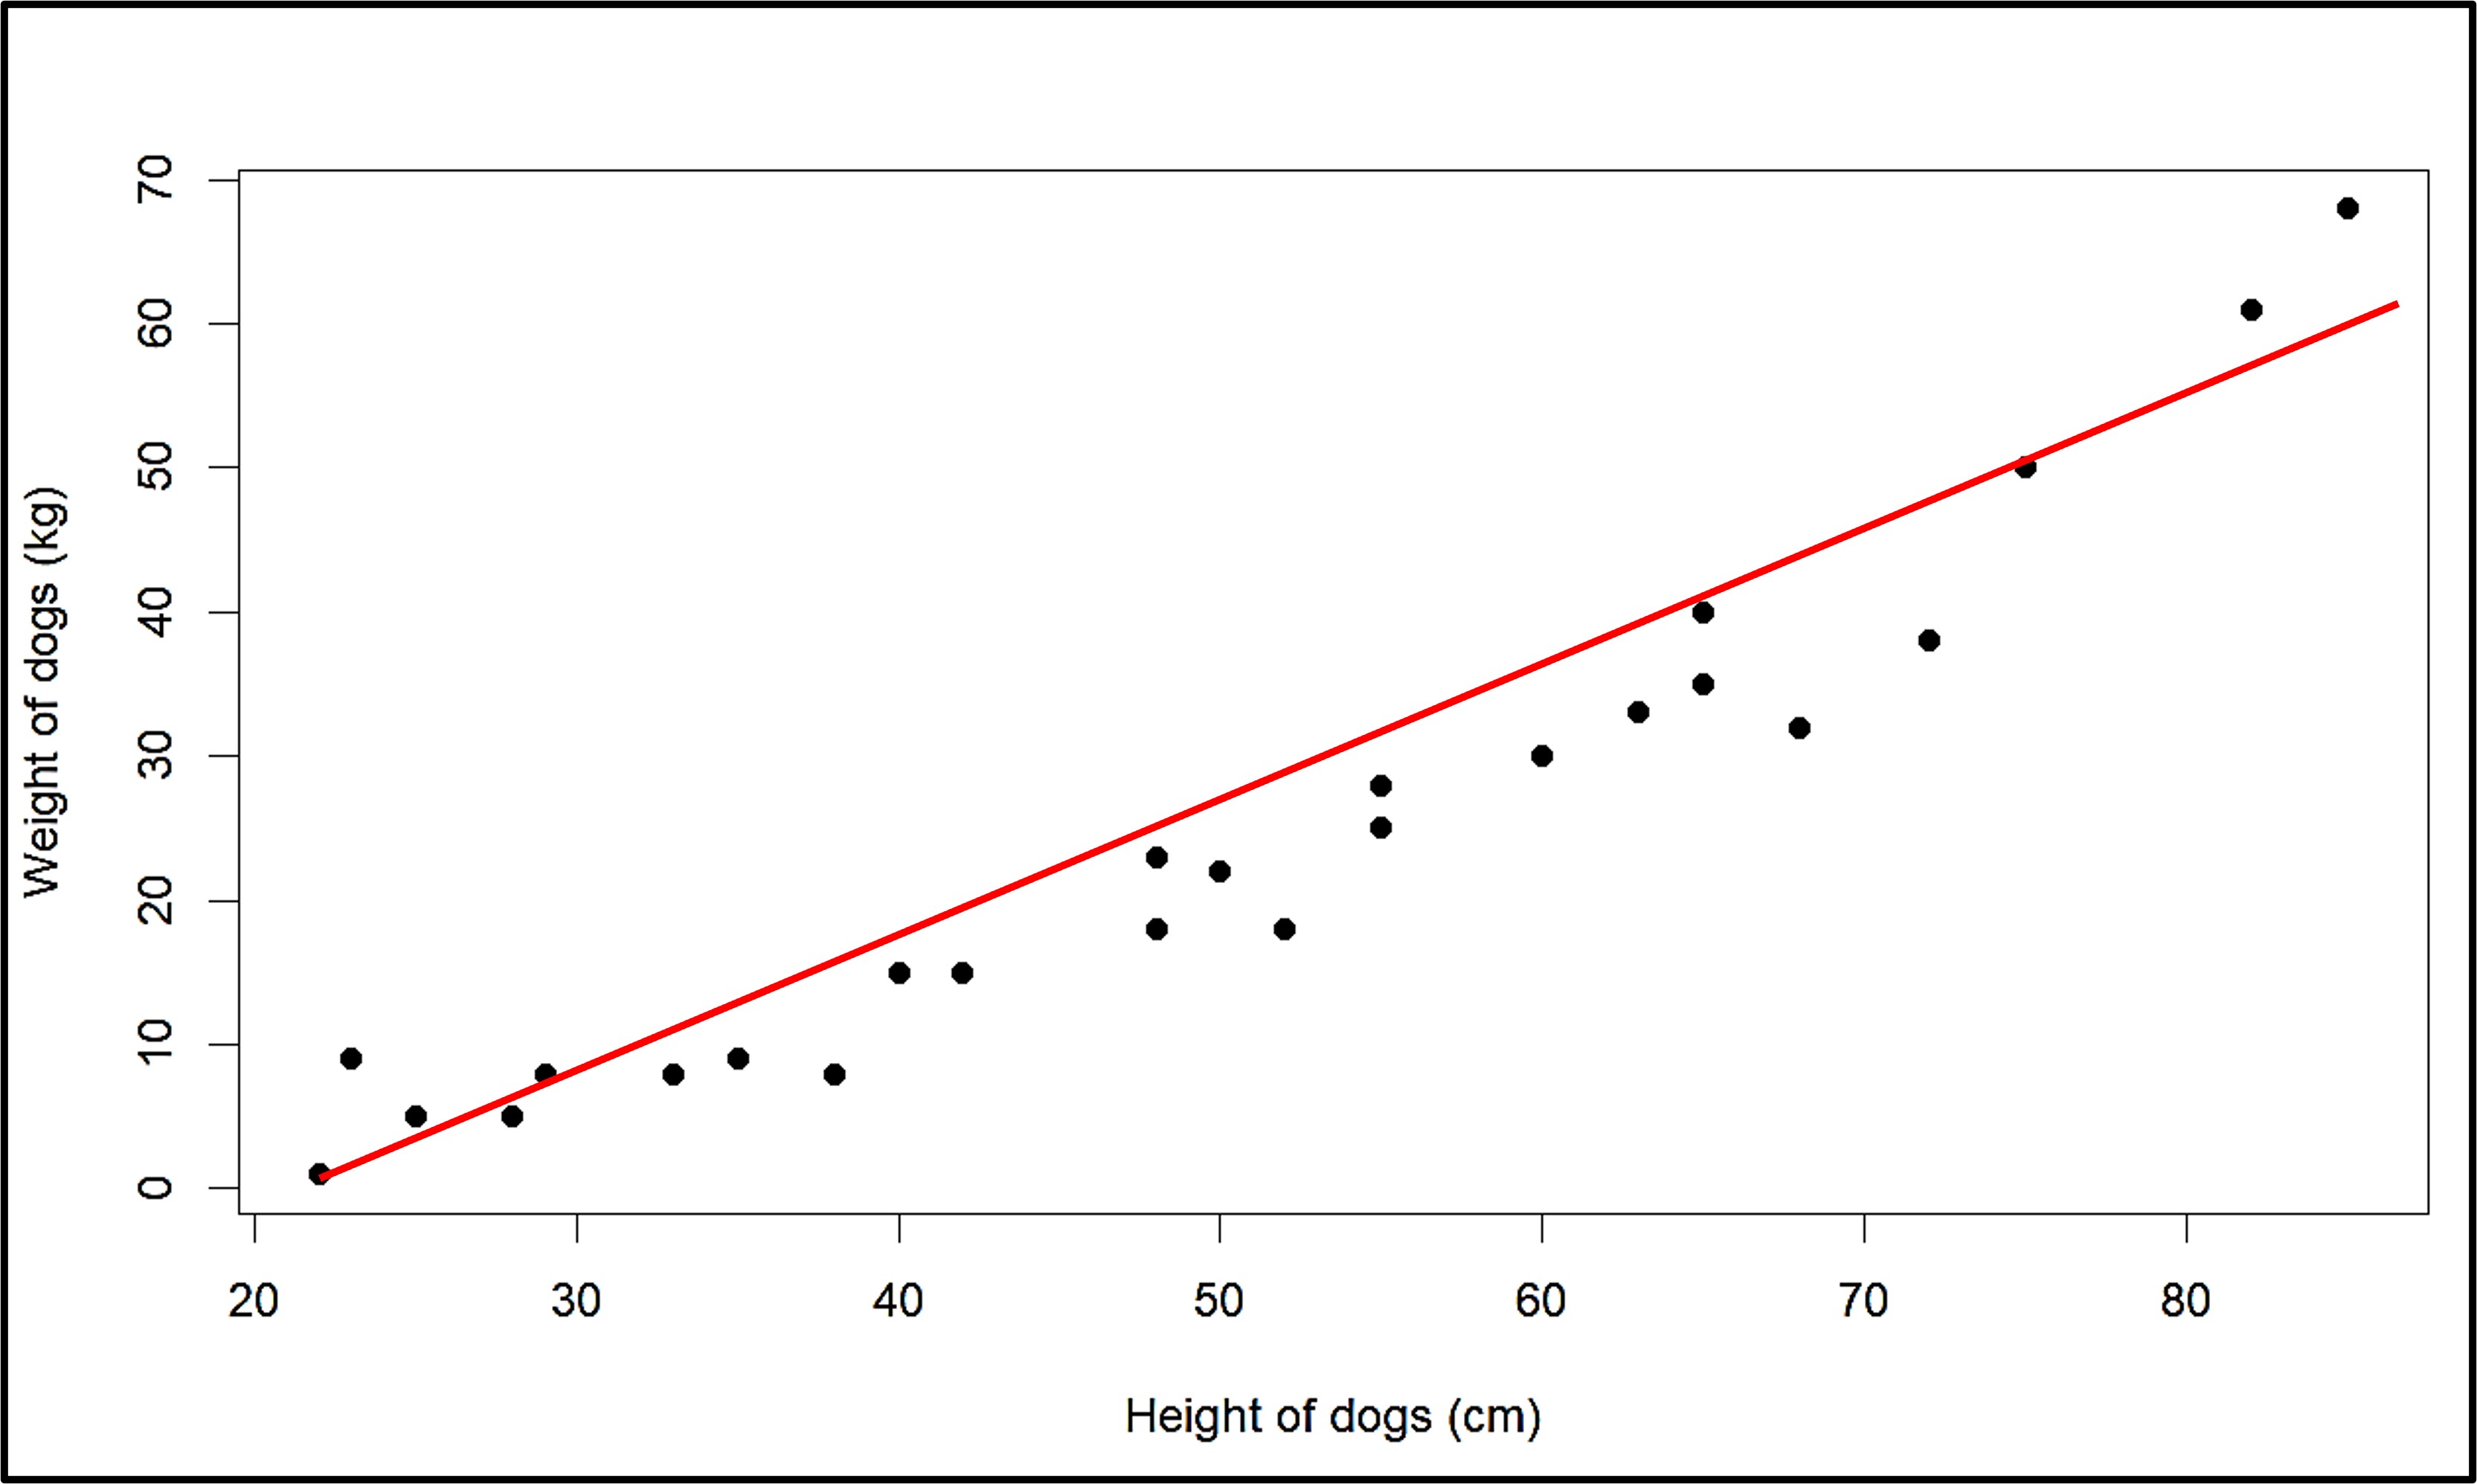
Earlier, we talked about drawing a line that fits a scatter plot to a linear association between the two variables. Let’s use the example of dog height and weight from before.
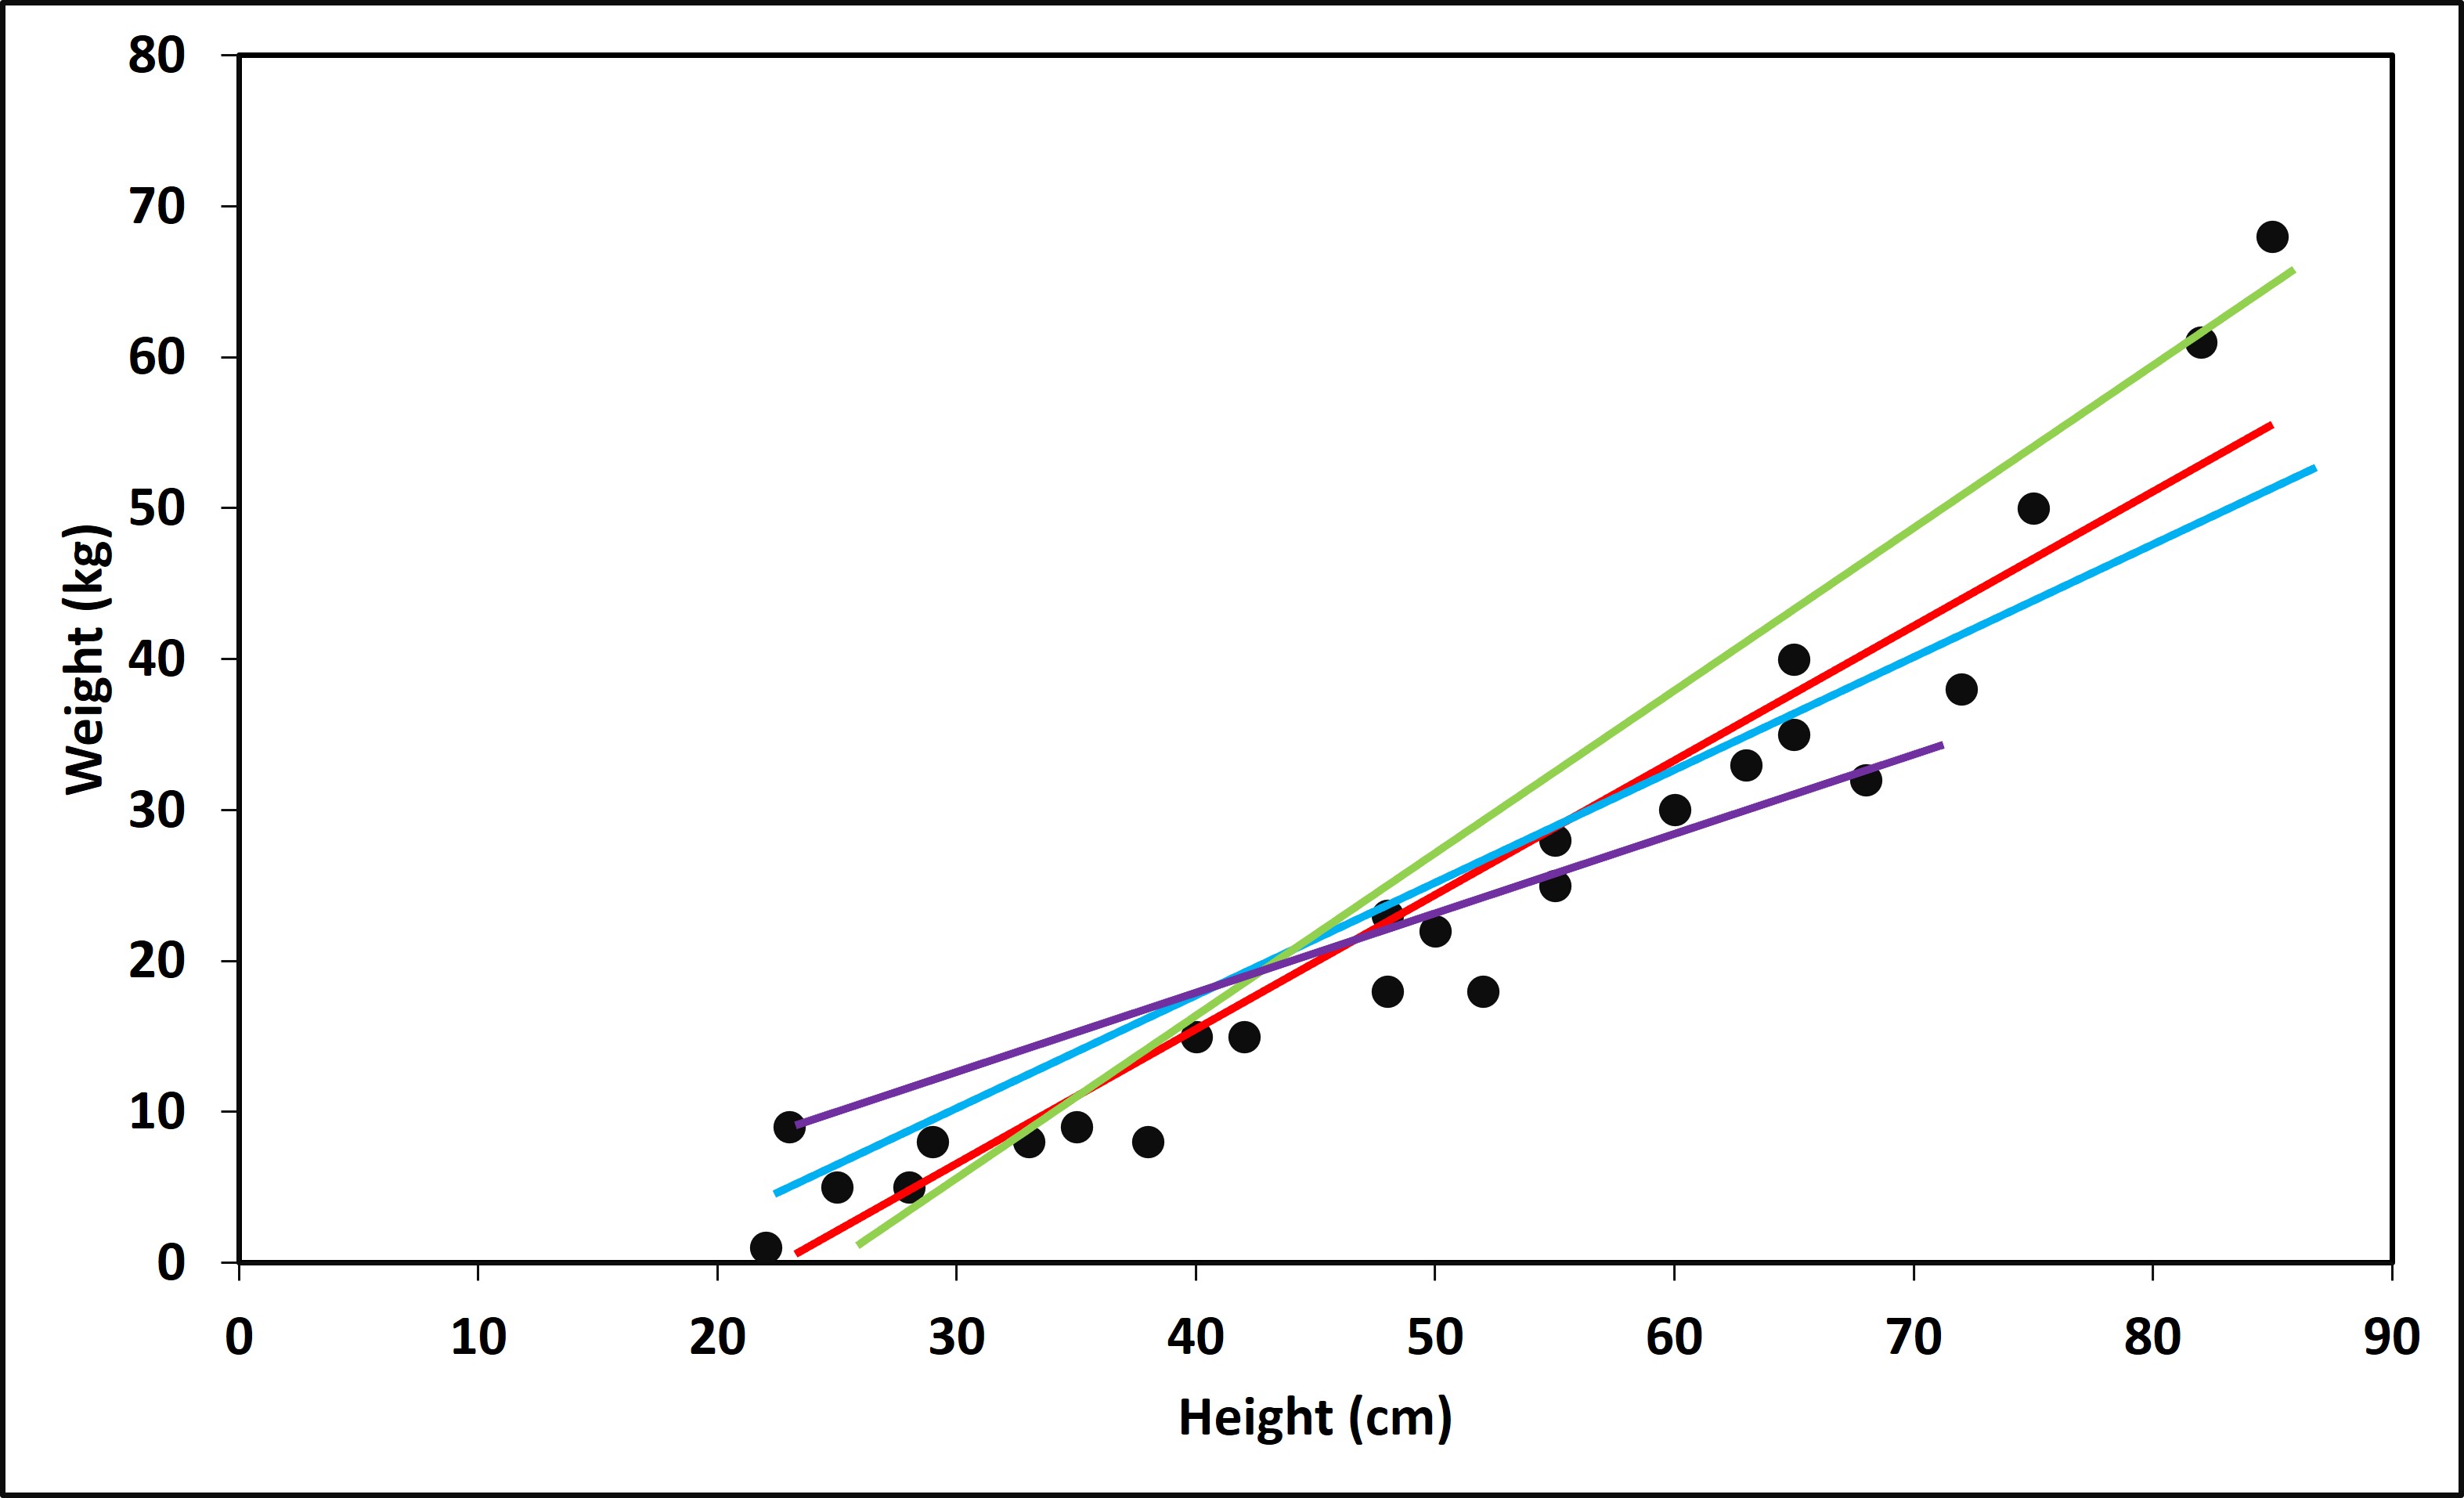
But, what kind of line should we draw? There are infinite ways we can draw a line that passes through these points.
Of course we cannot draw a line that passes through all points as it would not be a line at all, it would look something like this.
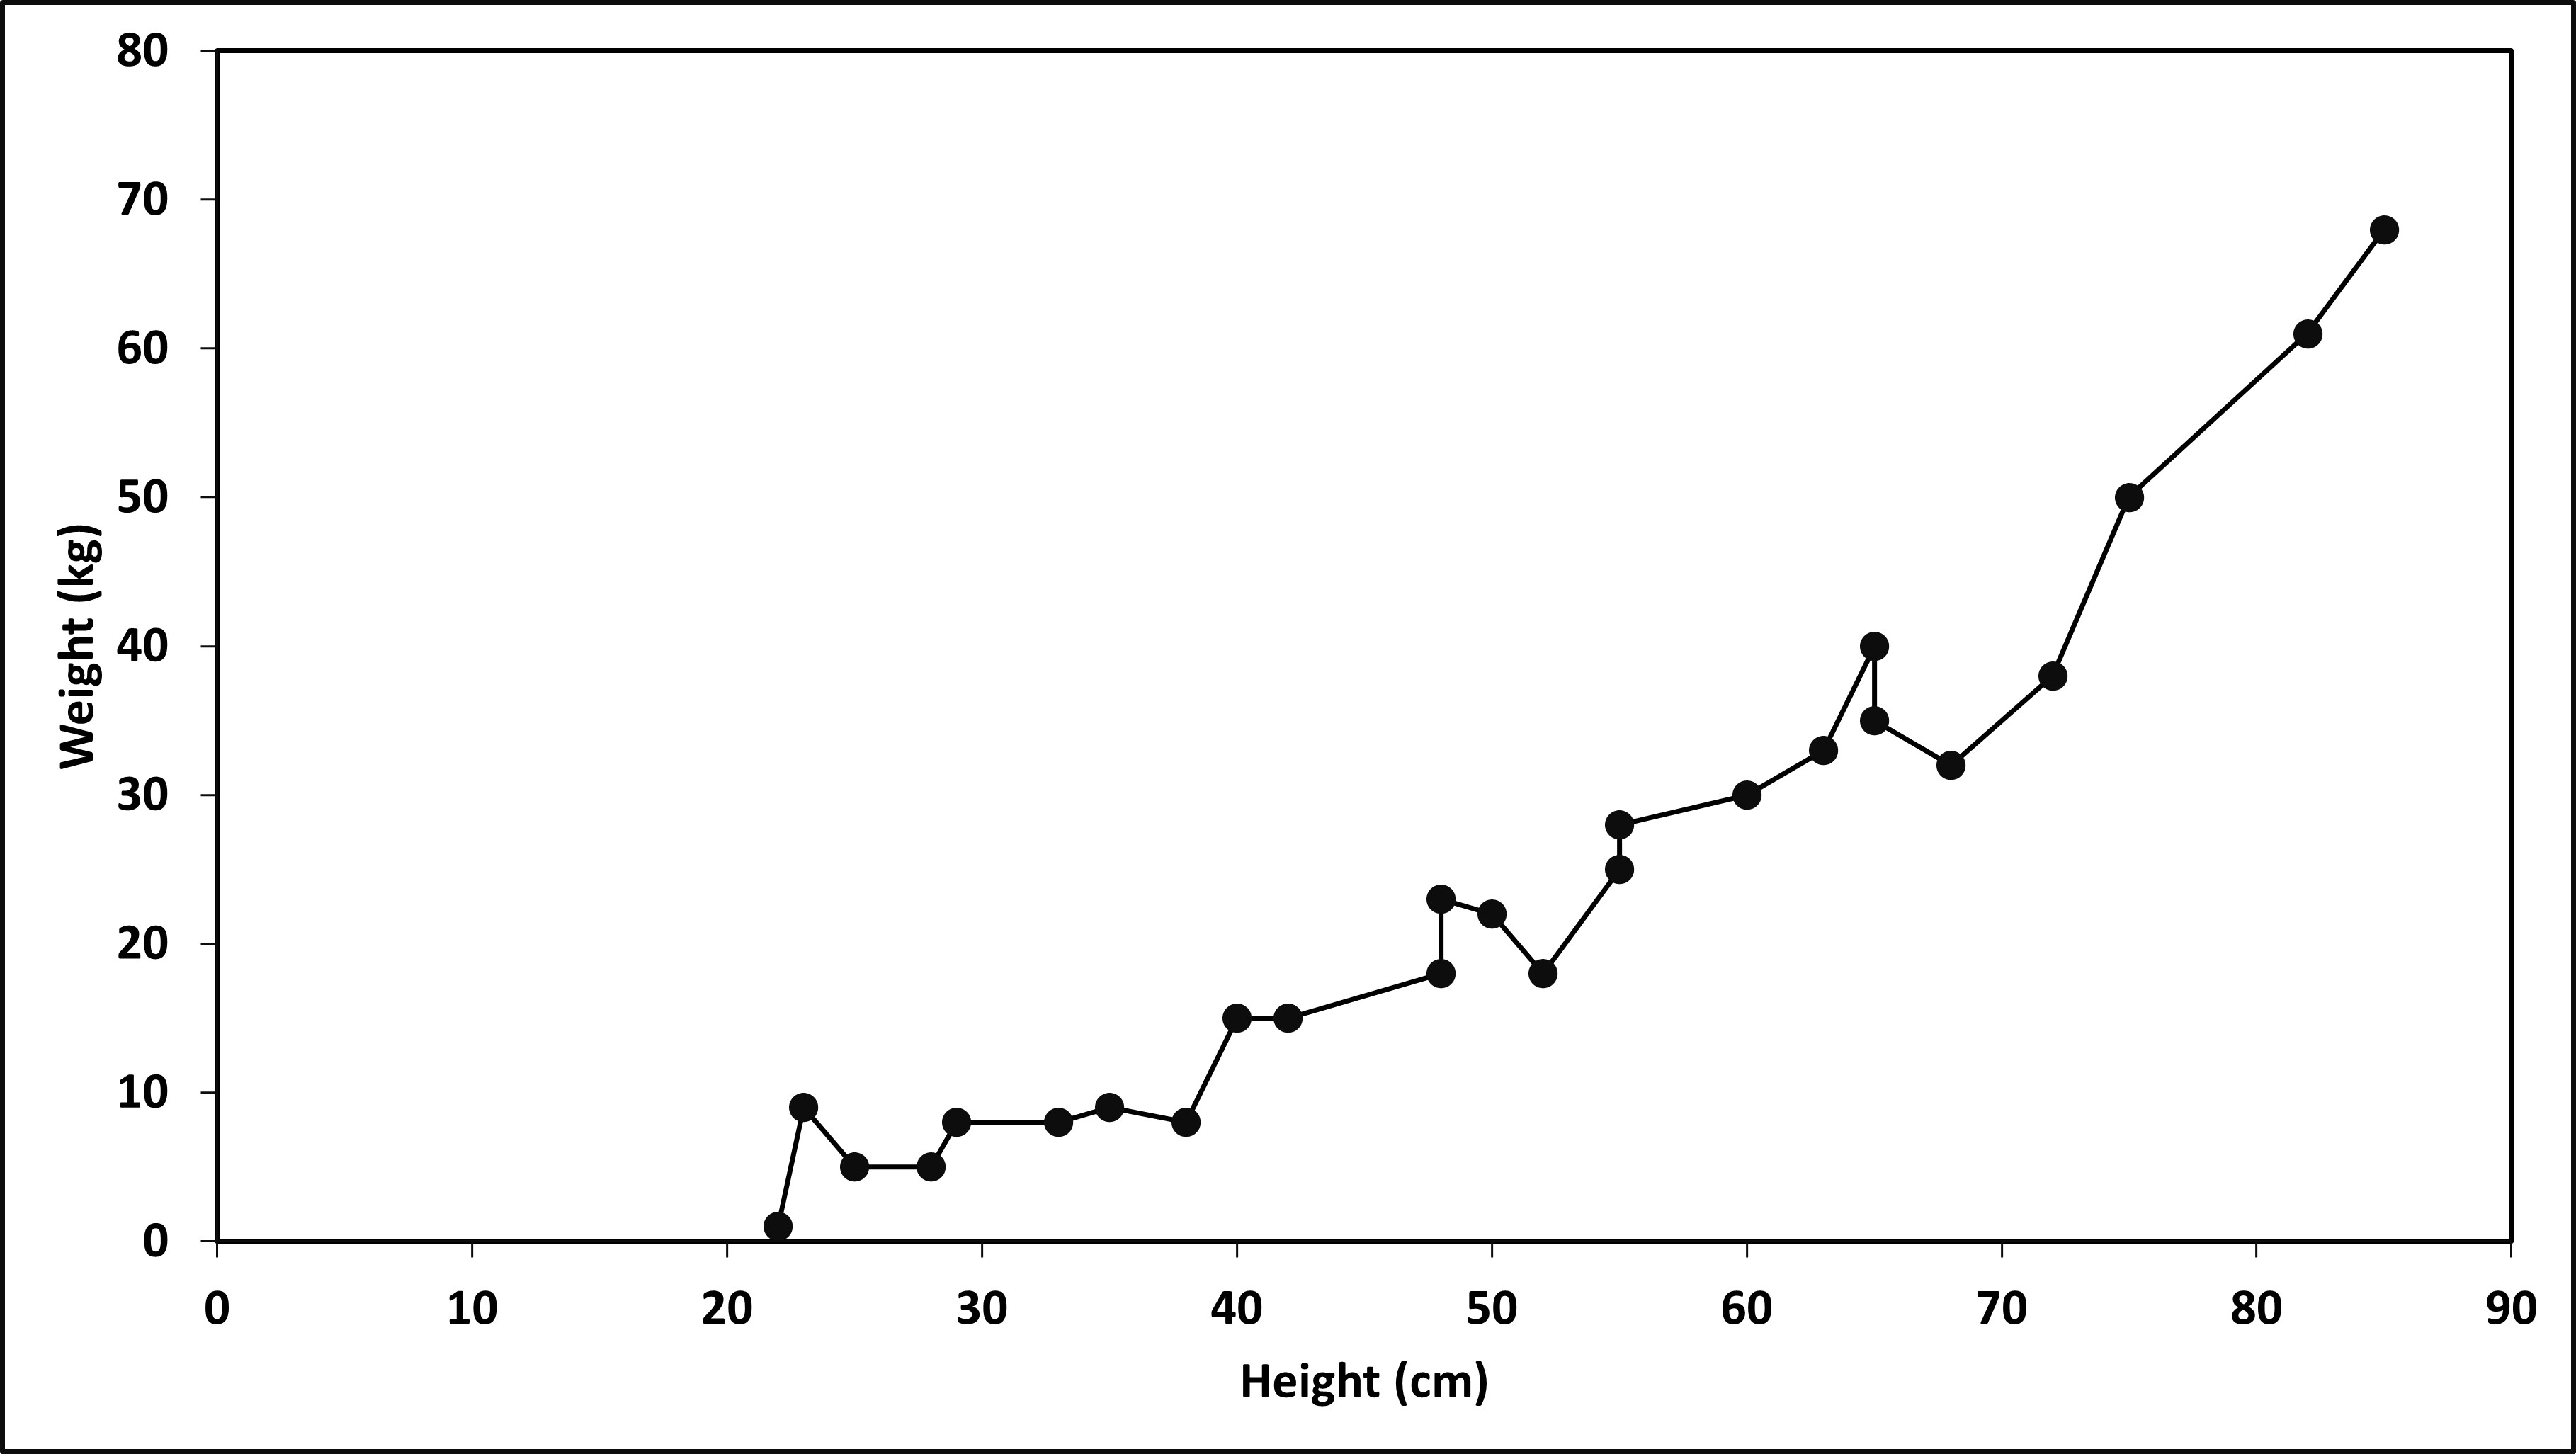
Not exactly a line right? So, to solve this, the easiest way to find this line is to take a ruler and try to fit the line that passes through as many of the points as possible. This line is the line that best fits the plot and it is appropriately named the line of best fit.
Do keep in mind what we learnt about some scatter plots with the best fit line being parabolas or some one other function like exponential. While they are not lines, we can still use the term best fit line. While making these lines, we need to be careful as to which one fits best, which is not necessarily always a straight line like the one given above.
In math, the decision on which line is best is not really done through making a guess. Rather, actual calculations are required where we find the distance between the line we made and all the points to find the smallest overall distance. But this will be taught later. For now, we will stick to making our best guess on how to make the line that covers the most points.